
Changes in the BRFSS Weighting Methodology
An Explanation of the Effects of the Introduction of Raked Weighting on BRFSS Data in Pennsylvania
The Behavioral Risk Factor Surveillance System is a cross-sectional telephone survey conducted by state health departments with technical and methodological assistance provided by the Centers for Disease Control and Prevention. The BRFSS survey consists of telephone interviews using randomly generated telephone numbers to determine the households contacted. The questions asked concern the leading causes of death, heart disease, cancer, diabetes, injury and other health-related behaviors.
Telephone surveys are weighted to reduce bias caused by non-coverage and nonresponse. Up until 2011, the data from the BRFSS survey were weighted by a standard method called post-stratification. Responses to the survey were forced to equal the age, sex and race proportions of adults in the household population. To be representative of the adult population of Pennsylvania, all the estimates reported are calculated with weighted data. The formula used to post-stratify BRFSS data before 2011 is: FINALWT=STRWT*1/IMPNPH*NUMADULT*POSTSTR
Where FINALWT is the weight assigned to each respondent, STRWT is the inverse of the sampling fraction of each stratum and accounts for differences in the basic probability of selection among strata, IMPNPH is the number of residential telephone numbers in the respondent's house, NUMADULT is the number of adult's in the respondent's household, and POSTSTR is the number of people in an age-by-sex or age-by-race-by-sex category in the population of a region or a state divided by the sum of the products of the preceding weights for the respondents in that same age-by-sex or age-by-race-by-sex category.
Post-stratification offered a means of providing the best possible prevalence estimates before 2011. However, societal changes often necessitate changes in survey methodology. Advancements in technology have had both positive and negative effects on the ability of telephone surveys, such as the BRFSS, to provide valid and representative data. The advent of extremely fast microprocessors for desktop computers and local area networks has enabled the routine use of more complex statistical weighting procedures to account for differences between survey respondents and the target population. The continuing trend towards the replacement of household landline telephones with personal cell phones in the United States has made it necessary to introduce new weighting measures.
As a result of these changes in technology, BRFSS managers decided to change the survey's weighting methodology. This methodological change required the CDC program representatives and state BRFSS coordinators and statisticians to work together closely to plan, test and implement these changes. As a result, beginning in 2011, the CDC implemented a new weighting methodology known as iterative proportional fitting, or raking. Raking is accomplished by adjusting for one demographic variable (or margin) at a time. For example, when weighting by age and gender, weights would first be adjusted for gender groups, then those estimates would be adjusted by age groups. This iterative process would continue until all group proportions in the sample approach those of the population, or up to 75 iterations. Raking allows for the incorporation of cell phone survey data, permits the introduction of additional demographic characteristics, and more accurately matches sample distributions to known demographic characteristics of populations.
Rather than adjust the survey population to match the overall population on only three demographic variables, raking weights will use the following eight demographic dimensions, some of which are the intersection of two demographic subgroups:
- age group by gender;
- detailed race/ethnicity;
- educational level;
- marital status;
- home owner or renter status;
- gender by race/ethnicity;
- age group by race/ethnicity; and
- telephone source (landline telephone only, both landline and cell phone, or cell phone only).
For those states that use regional weighting, such as Pennsylvania's eight health-planning regions, the raking procedures include these additional raking dimensions:
- region;
- region by age group;
- region by gender; and
- region by race/ethnicity.
A principle advantage of raking is that it allows the use of many more adjustor variables than poststratification. Such variables include telephone source, detailed race and ethnicity, regions within states, education level, marital status, age group by gender, gender by race and ethnicity, age group by race and ethnicity, and renter/owner status.
Together, the addition of the cell phone sample and the use of raking yield a more accurate weighting process and more precise estimates of the prevalence of health-related behaviors. The trend toward cell phone-only households is especially strong in younger age groups and among persons who are in racial or ethnic minority groups. The inclusion of the telephone source (landline or cell phone) in the weighting methodology allows the BRFSS to better represent lower-income and minority populations, factor in younger age groups, and represent the lower levels of formal education within a population.
The charts below present two trend lines. The red colored trend line indicates the post-stratification weighting method. The blue trend line is weighted by raking and includes both landlines and cell phones (LLCP) in the analysis (2009 was the first year that cell phone interviews were included in BRFSS).
Chart 1 displays trend lines from 2007-2021 of results for Pennsylvania adults age 18 and older who indicated they were ever told they have asthma. The estimates weighted by raking exhibit a slight increase in prevalence compared to post-stratification from 2009-2010. The inclusion of cell phones produced a minimal effect on the prevalence estimates from 2011 to 2021.
Chart 1: Adults Who Were Ever Told They Have Asthma
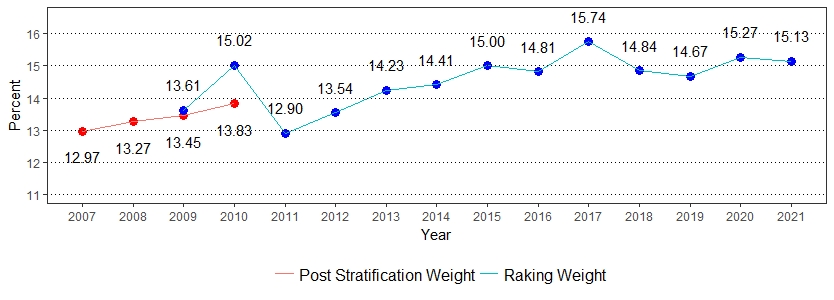
Source: Centers for Disease Control and Prevention (CDC)
As Chart 2 illustrates, raked weighting increased the prevalence estimates for each year from 2011 to 2015 among Pennsylvania adults who indicated they needed to see a doctor in the past 12 months but could not because of cost. The inclusion of cell phones did not have a major effect on the prevalence estimates.
Chart 2: Adults Who Needed to See a Doctor in the Past Year but Could Not Because of Cost
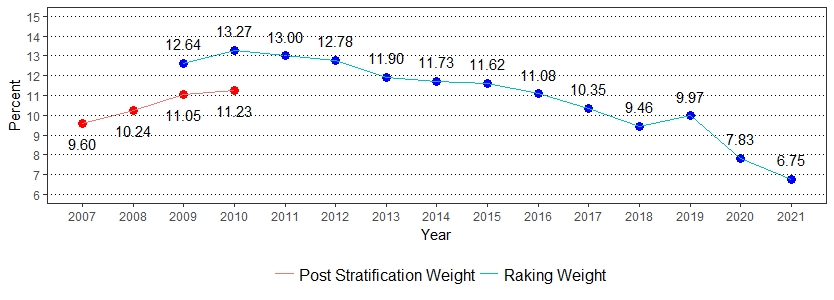
Source: Centers for Disease Control and Prevention (CDC)
Chart 3 shows that raking produces higher estimates for the proportions of people who do not have one person they think of as their personal doctor compared to the post-stratification method. Table 1 illustrates that young adults and minorities are more likely to not have their own doctor. The cell phone sample provides proportionally more respondents from those populations, and raking seems to have increased their contribution to the estimate.
Chart 3: Those Who DO NOT Have One Person They Think of as Their Personal Doctor or Health Care Provider
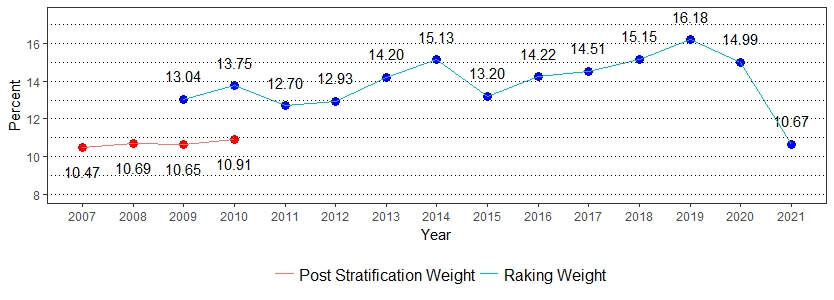
Source: Centers for Disease Control and Prevention (CDC)
Table 1: Raked Weighting - Pennsylvania Adults
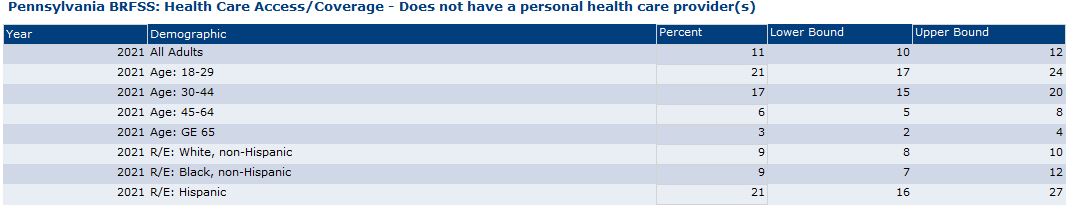
Source: Pennsylvania BRFSS, Bureau of Informatics and Information Technology, Division of Health Informatics
Changes in weighting procedures will create some differences in estimates, especially when new variables are introduced. Raking allows a better understanding of the associations between variables by controlling more factors through the weighting process. Additionally, raking allows for the inclusion of cell phone samples in the data. Raking ultimately reduces non-response bias and has been shown to reduce error within estimates. Overall, differences between the prevalence estimates between post-stratification and raking are very small, in most cases, and not likely to be noted in trends of responses over time.